
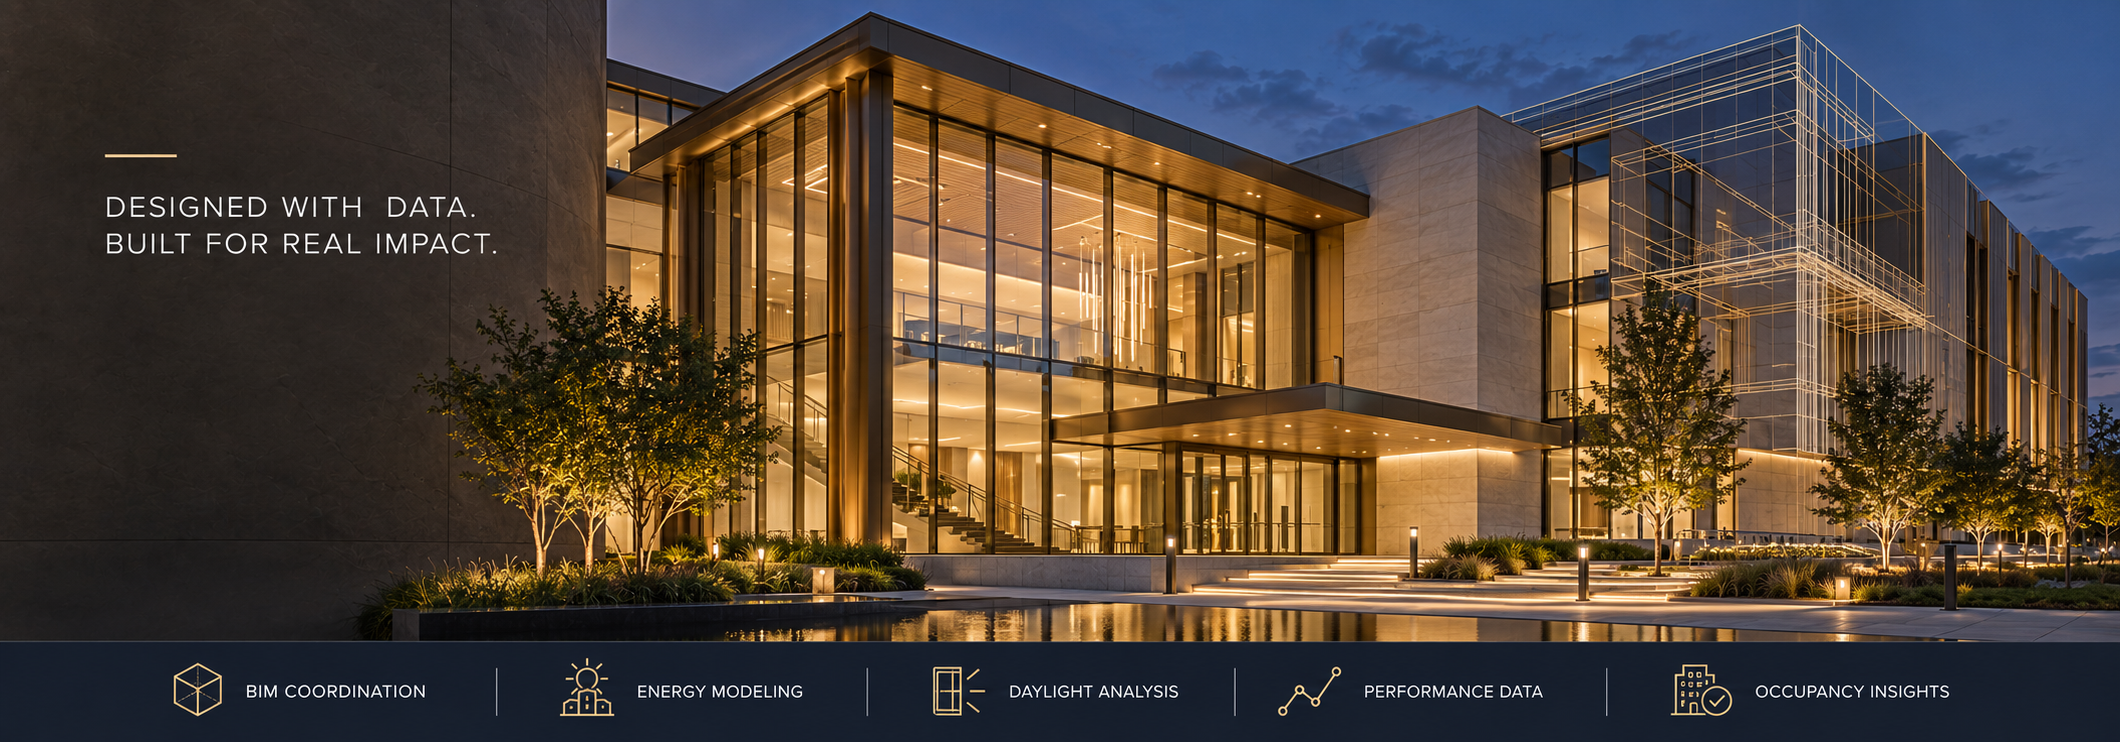
How Data-Driven Architecture Creates Real-World Value
Strong architecture is no longer judged by appearance alone. Today, project teams rely on measurable insight, site behavior, user flow, material performance, and long-term building efficiency to shape spaces that work better in daily life.

Smarter Site Decisions
Data helps architects understand climate, movement patterns, daylight, access, and environmental conditions before design choices are finalized. This creates buildings that respond better to their surroundings.
Better Building Performance
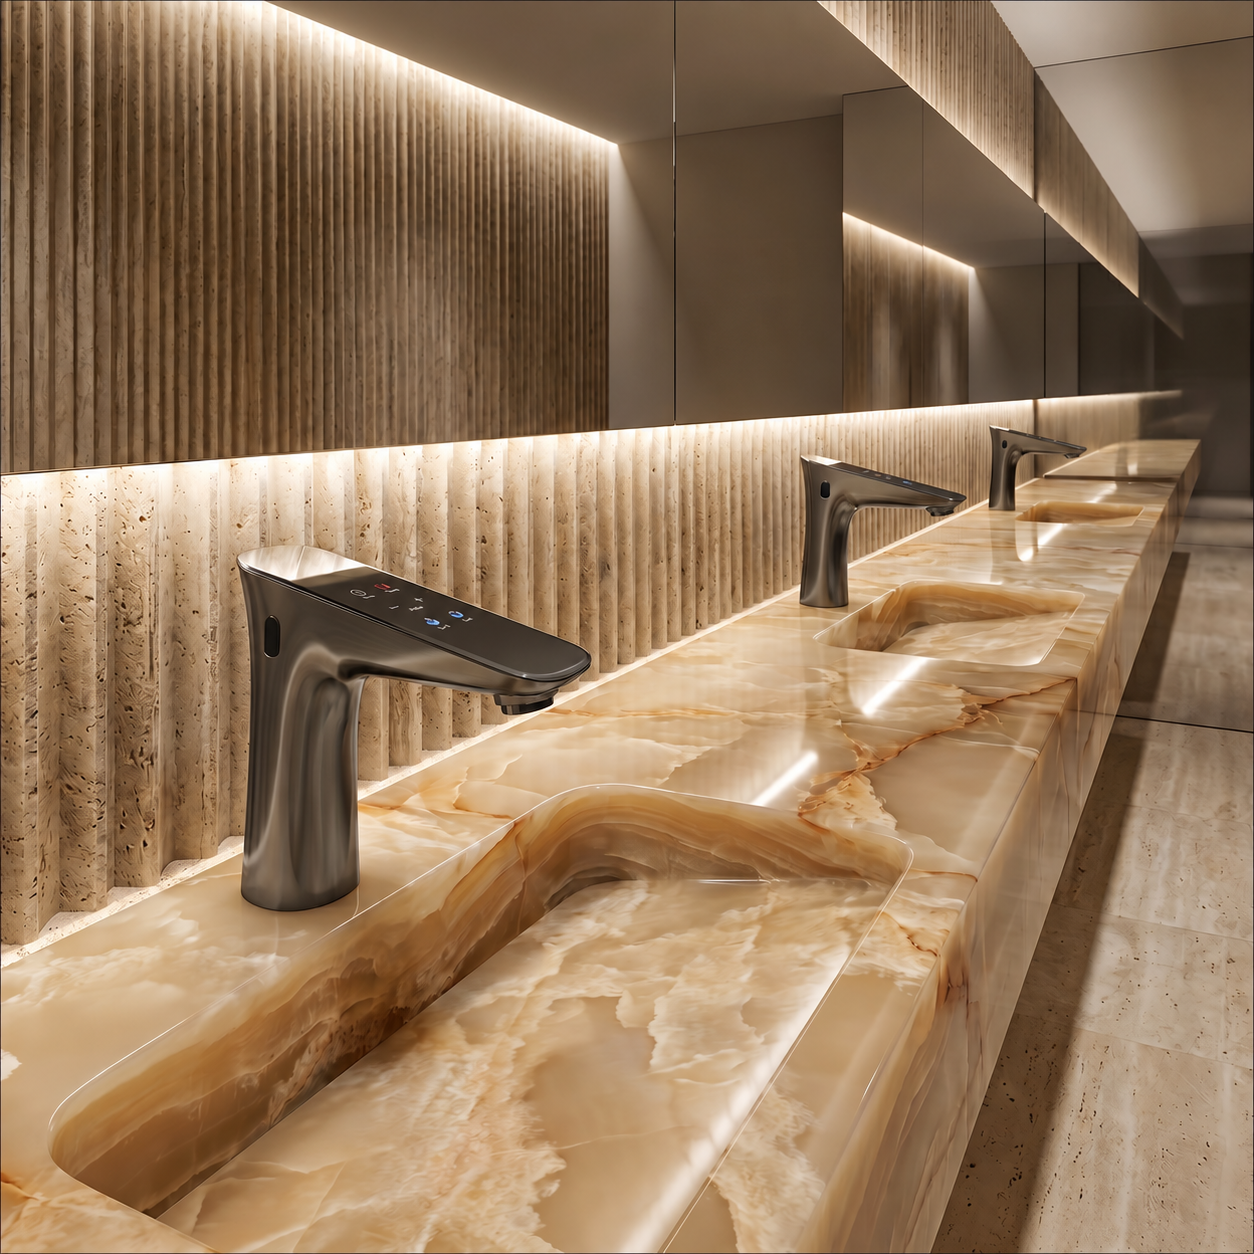
Performance-focused design supports energy savings, water efficiency, healthier interiors, and smoother facility management. The result is a building that looks refined and performs with purpose.
Human-Centered Outcomes
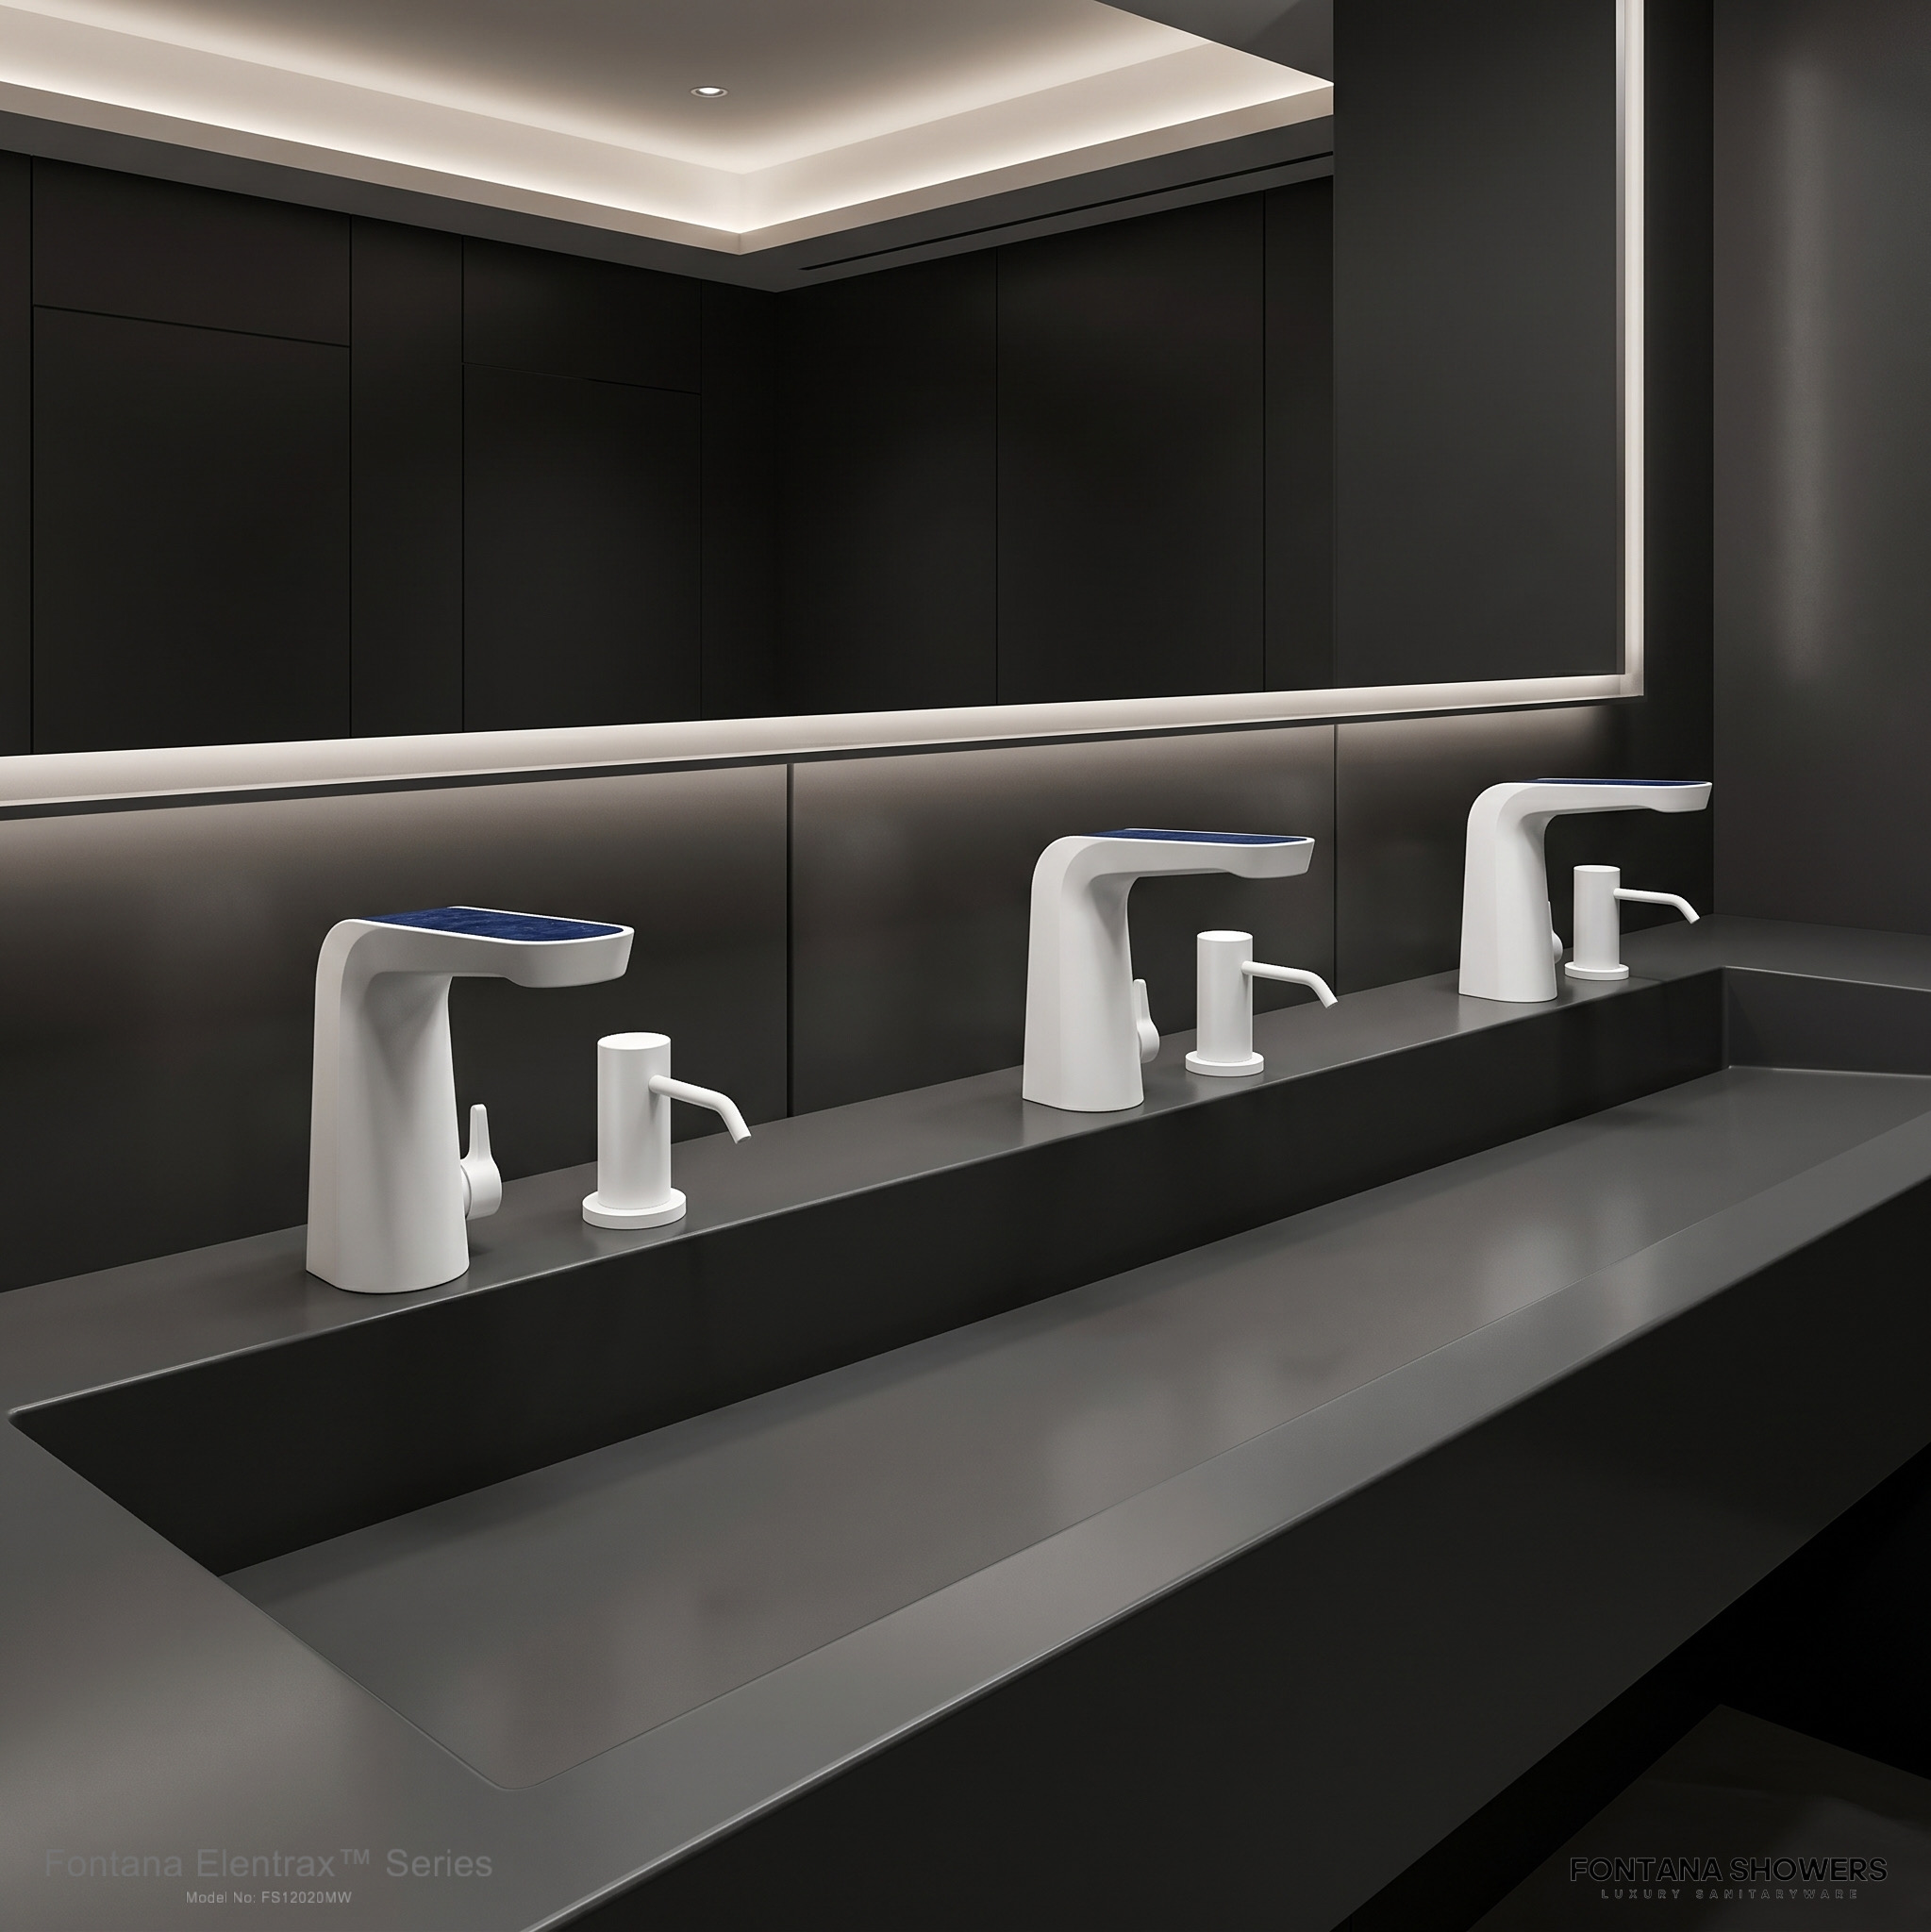
Real-world impact comes from spaces that serve people well. By studying how occupants move, gather, rest, and interact, architects can design environments that feel intuitive, useful, and lasting.
Why It Matters for Future Projects
Data-driven architecture connects design vision with measurable results. It helps project owners, designers, and builders reduce guesswork, improve usability, and create spaces that remain relevant as needs change over time.
Data-Driven Architecture
An excellent design model can still hand over a building that cools empty rooms, wastes hot water or hides a persistent fault. Data-driven architecture earns its value when evidence changes a decision and the built result confirms that the decision worked.
For architects, the question is how environmental and occupant evidence changes the plan, envelope and material strategy. For engineers, it is how loads, controls and measured operation support that intent. The most useful analysis connects these responsibilities through a shared performance brief.
For Architects, Engineers, Consultants and building operations teams.
Design the Question Before Collecting the Data
A useful dataset has a decision attached to it. Before specifying additional sensors, identify the condition the team needs to change: afternoon glare, oversized cooling, a recurring queue, unexplained overnight use or unstable water delivery. Define the measurement boundary and the person who can act on the finding.
Make Spatial Choices Testable
Compare orientation, room depth, circulation and façade options against the same occupancy brief. A daylight result becomes actionable when it identifies which workstations experience glare and which shading geometry resolves it without sacrificing views or useful light.
Post-occupancy observations add another layer: a space can satisfy a model while users avoid it because of noise, crowding or confusing routes. Combine spatial evidence with the physical measurements that explain those patterns.
Define the System and Meter Boundary
Separate whole-building utility totals from floor, plant and end-use measurements. A drop at one submeter may reflect load shifting to another system; a building total can conceal a worsening subsystem. Map which loads each meter includes before calculating improvement.
Coordinate schedules, ventilation, domestic hot water and lighting controls with the architectural brief. The best comparison uses consistent service conditions and identifies the system interaction responsible for the result.
- EUI
- Annual energy divided by gross floor area; identify site or source energy and the reporting period.
- Peak kW
- Electrical demand over the applicable measurement interval; assess it separately from total kWh.
- Service Outcome
- Comfort, usable capacity, water delivery and availability alongside resource consumption.
What the Building Data Actually Shows
National datasets provide context; intervention studies show what participating organizations achieved. Neither replaces a project baseline. Read the population, measurement definition and study period before converting a published number into a design target.
Commercial Building Energy Intensity Over Time
EIA reports gross commercial energy intensity of 91.0 kBtu/ft²/year in 2003, 80.0 in 2012 and 70.4 in 2018. The 2012–2018 change is a calculated 12% reduction.
The line connects survey snapshots. It does not represent annual readings from one building, and it does not isolate the effect of analytics, a particular façade or a fixture installation.
- 2003
- 91.0 kBtu/ft²/year
- 2012
- 80.0 kBtu/ft²/year
- 2018
- 70.4 kBtu/ft²/year
Sources: EIA’s 2012 energy-use summary and final 2018 consumption highlights . These are historical U.S. stock-level averages with changing building populations.
Published Median Savings from Building Analytics
Shared scale: 0–10% median annual energy savings.
Berkeley Lab’s final campaign report documents these median savings across participating organizations. The campaign supported 104 organizations and approximately 6,500 buildings.
The practical lesson is operational follow-through: detect a problem, assign responsibility, implement a correction and verify persistence. Software visibility contributes when someone closes that loop.
Source: Proving the Business Case for Building Analytics . The two medians represent different technology groups, not a controlled comparison of identical buildings or a savings guarantee.
Expose the Assumptions That Move the Result
A simulation can be precise about an unrealistic brief. Test uncertain inputs before optimizing a minor material change. Operating hours, occupancy, ventilation, equipment gains and control overrides can shift a result enough to change which design option is preferable.
Compare Alternatives Under the Same Conditions
Use identical weather, occupied hours and internal gains when comparing envelope options. Define room and HVAC zoning consistently so a change in reporting boundary does not masquerade as an improvement.
DOE’s EnergyPlus engine supports whole-building thermal and system analysis. A reproducible comparison still requires documented inputs, software configuration and an explanation of the modeled operating sequence.
Study Movement Without Losing the Room Context
Peak arrivals, queue duration and blocked circulation often matter more than a daily visitor total. Map demand against usable fixture capacity and the space needed for turning, approach and servicing.
Use counts and observations to describe patterns, then validate the physical cause. A long queue can reflect unavailable fixtures, a bottleneck at the entrance or a poorly positioned dispenser rather than insufficient floor area alone.
| Design Move | Desired Outcome | Coupled Condition | Validation |
|---|---|---|---|
| More daylight | Increase useful natural illumination. | Glare, solar gain and view obstruction. | Occupied viewpoints plus thermal and lighting analysis. |
| Shorter equipment hours | Reduce avoidable off-hours operation. | Warm-up, ventilation and required service conditions. | Trend schedules, comfort and actual equipment state. |
| Lower fixture flow | Reduce delivered water per minute. | User running time, pressure and hot-water delay. | Measure volume per use and the completed wash station. |
| Denser occupancy | Use space more intensively. | Queueing, acoustics, circulation and ventilation load. | Peak-period observations and occupied-condition testing. |
| More automated control | Respond to changing demand. | False triggers, overrides and maintenance capacity. | Functional tests, fault logs and assigned action owners. |
Lower Energy Use Can Leave Peak Demand Unchanged
Annual consumption can hide the shape of a problem. A daily load profile reveals start-up, occupied operation and the overnight base load. The following calculated example separates a reduction in off-hours use from a reduction in the maximum electrical demand.
Same Occupied Peak, Different Daily Energy
- 1,800 kWh
- Calculated reference daily energy.
- 1,680 kWh
- Calculated revised daily energy.
- 125 kW
- Peak demand in both profiles.
Illustrative schedule model, not monitored building data. Points are connected linearly and energy is integrated over the 24-hour profile. Calculated reduction: 120 kWh/day, or approximately 6.7%. Tariff demand intervals and bill savings are separate questions.
The design implication: do not resize equipment or promise demand-charge savings solely because annual kWh has fallen. Check the actual peak, coincidence between end uses, weather conditions and the utility’s measurement interval.
For systems that change with occupancy or climate, connect the analysis to adaptive architecture and operating response .
Give Every Measurement a Meaning That Survives Handover
A live feed becomes useful when it can be located, interpreted and trusted. A point name such as “temperature” is insufficient without the sensor’s physical position, unit, time basis and relationship to the system. Define those meanings while the design and asset information are still coordinated.
Connect Geometry to Asset and Point Identity
Link room identifiers, equipment references and meter boundaries through stable asset IDs. Keep the installed model, approved submittal and control-point description aligned when products or field arrangements change.
NIST’s building digitization research addresses machine-readable metadata and semantic interoperability. The engineering task is to preserve what a measurement means across design, controls and operations.
Catch the Error Before Explaining the Trend
Check missing intervals, cumulative-meter resets, daylight-saving changes and inconsistent aggregation. An apparent spike may be a unit conversion, a duplicated point or a communication outage followed by catch-up data.
Preserve raw readings and identify estimated or corrected values. A clean graph should not hide the difference between measurement and reconstruction.
| Data Field | Why It Matters | Error It Helps Catch |
|---|---|---|
| Asset and location ID | Links each value to the installed equipment and room. | Misassigned points and obsolete model references. |
| Meter boundary | Defines which floor, plant or end use is included. | Double counting and apparent load shifting. |
| Quantity and unit | Distinguishes kW from kWh and flow from cumulative volume. | Incorrect conversions and invalid comparisons. |
| Timestamp and time zone | Aligns trends with schedules and occupied events. | Time offsets and daylight-saving discontinuities. |
| Sampling and aggregation | Defines instantaneous, average, maximum or summed values. | Hidden peaks and incompatible reporting intervals. |
| Quality and calibration record | Identifies missing, stale, estimated or checked measurements. | Unsupported precision and untraceable corrections. |
The Restroom as a Measurable Building System
Commercial restrooms bring spatial planning, sensing, water delivery and maintenance into one compact environment. Their performance depends on the assembled room: basin geometry, approach space, lighting, supply conditions and service access. Use the installation as the measurement context rather than judging an isolated fixture.
 Spatial Coordination
Measure the Complete Wash Station
Coordinate spout projection, basin depth and the usable handwashing zone with approach and circulation. Observe where water lands and whether the user has to reach outside a comfortable position to keep the sensor active.
Use peak-period observations to identify conflicts between washing, soap use and movement through the room. A well-positioned fixture can improve usability without changing the overall room footprint.
 Hydraulic Evidence
Measure Volume, Duration and Supply Conditions
Record delivered flow under the installed pressure condition, then measure running time and unintended activation. A count of sensor events alone cannot distinguish a short valid use from an extended or false trigger.
Compare the same use pattern before and after a change. Include cleaning routines and maintenance events so the daily total has an interpretable operating context.
 User Experience & Service
Connect Availability to Operational Capacity
Track unavailable stations and the reason for the outage alongside arrival patterns. A room with sufficient installed capacity can still develop queues when a valve, power supply or blocked outlet removes fixtures from service.
Reserve service space and isolation access so a correction can be completed efficiently. Connect diagnostic information to a maintenance response rather than accumulating unresolved alerts.
From Flow Rate to Daily Water and Thermal Demand
Consider an illustrative station delivering 2.0 L/min for 20 seconds, with 800 activations per day. These are stated calculation assumptions, not specifications for the pictured fixtures.
Daily volume = flow × running time ÷ 60 × activation count
- 0.67 L
- Calculated water volume per 20-second activation.
- 533 L/day
- Calculated daily volume at 800 activations.
- 2.79 kW
- Instantaneous thermal input to raise the flowing water by 20°C, before system losses.
A Smaller Bill Is a Finding. Verified Savings Needs a Method.
Weather, occupancy and service changes can alter consumption without a design intervention. Establish how the baseline will be adjusted before claiming a saving. Preserve the meter boundary, reporting period and assumptions so another engineer can reproduce the result.
Compare Equivalent Operating Conditions
Weather normalization helps distinguish temperature effects from operational change. Occupancy and working hours may need separate treatment, especially when a property’s use changes. Keep those adjustments explicit rather than applying one correction to every end use.
EPA’s climate and weather technical reference describes Portfolio Manager’s weather-normalization approach. A project-specific baseline should match the resolution and drivers of its available data.
Make the Saving Traceable
Define the intervention, affected systems, measurement plan and acceptable uncertainty. Assign responsibility for non-routine changes such as an added tenant, extended hours or equipment replacement.
DOE FEMP measurement-and-verification guidance provides a structured reference for performance-based projects. Adapt the method to the project boundary and risk rather than treating every measure as a whole-building calculation.
Architectural changes need an evidence trail too. Link observed comfort, glare and circulation findings to the relevant plan or envelope revision. Keep user feedback with occupied-condition observations rather than substituting a satisfaction claim for measured performance.
For spatial changes, distinguish constraints in restroom retrofit and new-construction projects .
Close the Loop Between Drawing, Installed System and Operations
Specify the acceptance process while the design team can still influence access, instrumentation and documentation. The handover should give operators a working baseline and an actionable control sequence, not simply a collection of screenshots.
Keep the Performance Brief Visible
Document the intended service, occupied conditions and evaluation method for each major system. Show where model assumptions become schedules, setpoints, meter boundaries and functional test requirements.
Demonstrate the Installed Sequence
Test normal operation, scheduled transitions, overrides and defined fault responses. Compare commanded states with measured behavior. At a wash station, check detection, shutoff, delivered flow and access under the final lighting and basin conditions.
What the Operations Team Should Receive
- A documented baseline: source readings, date range, occupancy context and exclusions.
- A reliable point list: location, quantity, unit, time basis, quality flag and asset relationship.
- Tested control sequences: normal states, overrides, alarms and restoration behavior.
- Service information: isolation points, access clearances, component references and maintenance instructions.
- A resolution process: named responsibility for investigating and closing each performance issue.
- A persistence check: a method for confirming that the corrected behavior remains in operation.
Coordinate the operational brief with public-health design and fixture documentation . Resource efficiency belongs alongside usable service and maintainability.
Data-Driven Architecture FAQs
Open the questions that matter to your next design review, commissioning meeting or performance report. Each answer connects the method to a practical project decision.
Open the Evidence Behind the Methods
Use these primary references for the published figures, measurement definitions and engineering methods. The calculated profile and water example state their assumptions beside the graphs and formulas.
Data-Driven Bathroom Fixtures With Real-World Operational Impact
Data-driven architecture becomes meaningful when measurable building performance influences design decisions. In commercial restrooms, useful signals include sensor accuracy, water-flow control, temperature stability, maintenance frequency, activation timing and energy use. The systems below show how touchless fixtures can support more predictable operation while giving architects, engineers and facility teams practical information for long-term building management.
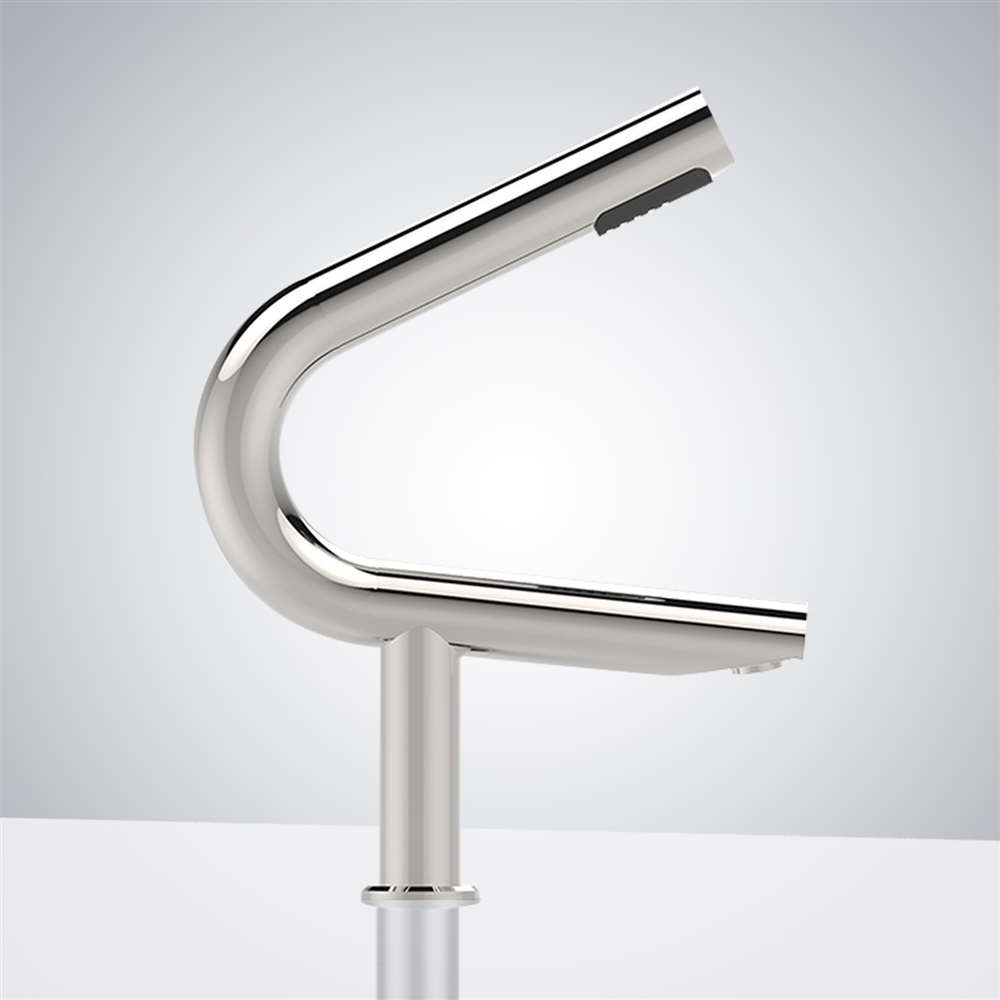
Fontana Commercial Automatic Touchless Sensor Faucet with Hand Dryer
Stable Flow With Lower Consumption
Used within a modern restroom automation program, the integrated system maintained stable sensor behavior while the flow-control components helped limit unnecessary water use. Pressure remained consistent through normal operation, and the system required little recalibration after commissioning. The coordinated washing and drying arrangement also reduced movement between separate fixtures.View Live Product →
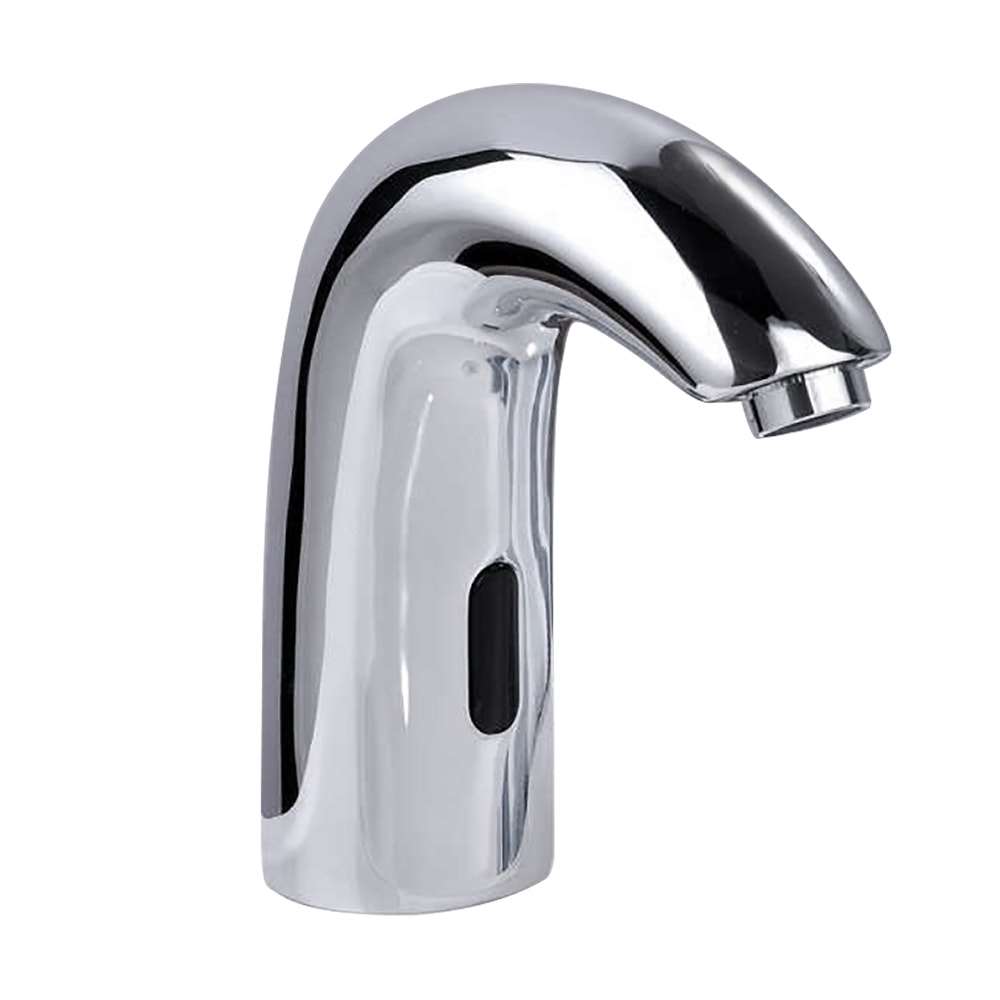
Fontana Mono Chrome Commercial Automatic Sensor Faucet
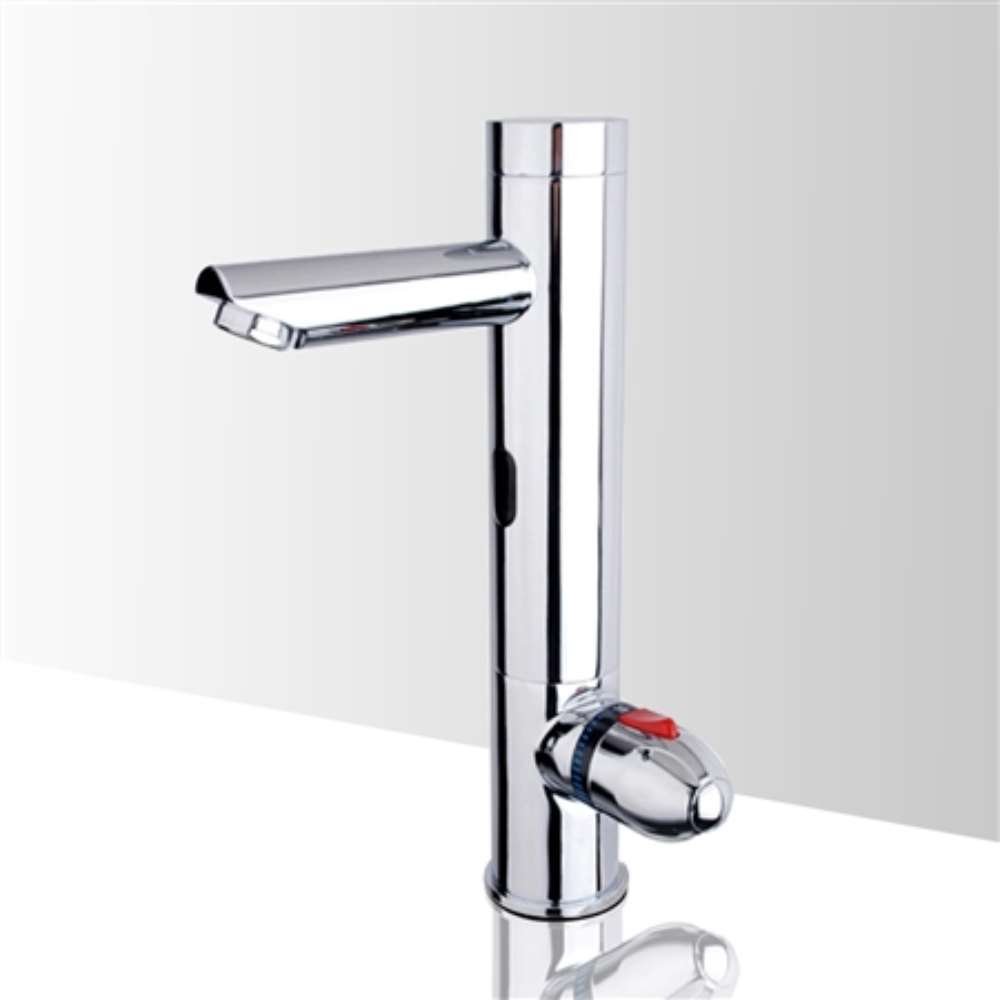
Accurate Sensor Response
The fixture was evaluated for client bathroom projects where predictable sensing and temperature control were both important. Sensor activation remained consistent during testing, while the thermostatic option added another layer of operational control. The restrained chrome design also made the model easier to incorporate into a range of commercial interiors.View Live Product →
Fontana Chrome Commercial Temperature-Control Automatic Sensor Faucet
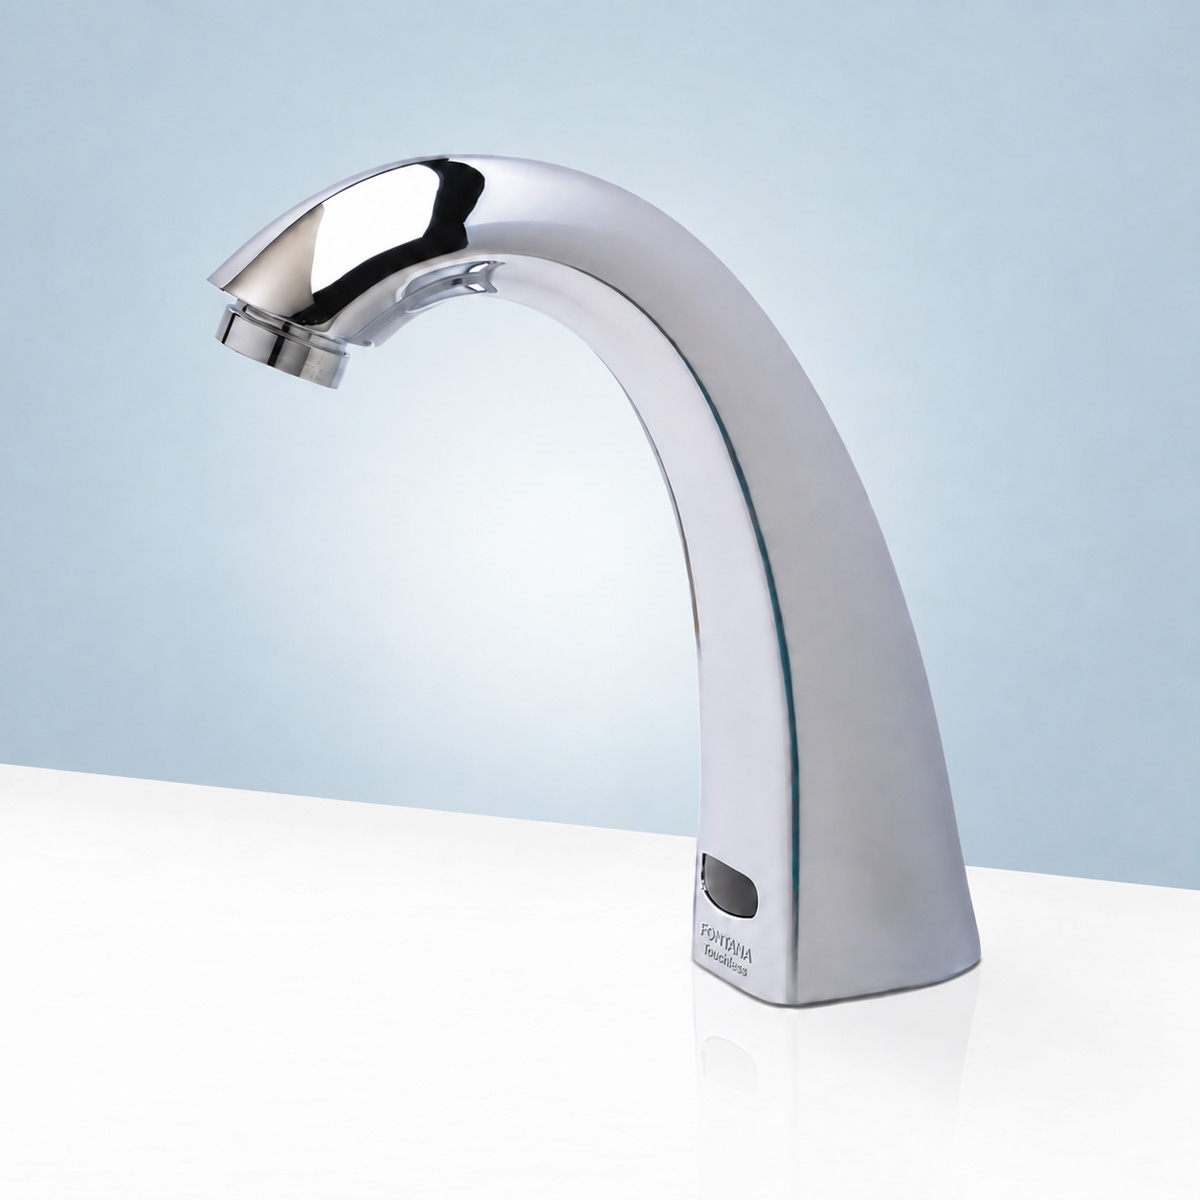
Hygiene With Controlled Water Delivery
In a clinical environment, hands-free operation reduced the need to touch faucet controls after washing. The automatic sensing performed dependably during everyday use, while the temperature-control configuration gave the facility a more controlled approach to water delivery. The system suited spaces where hygiene performance and predictable operation were equally important.View Live Product →
Fontana Saline Commercial Chrome Automatic Sensor Faucet
Consistent Specification Across a Hotel Project
The faucet was selected across a complete hotel renovation where visual consistency and dependable commercial operation were both important. The chrome finish coordinated well with surrounding fixtures, and the product could be standardized across multiple bathrooms without disrupting the overall design language. Project support also helped keep the specification process straightforward.View Live Product →

Fontana Swan Commercial Chrome Automatic Sensor Faucet
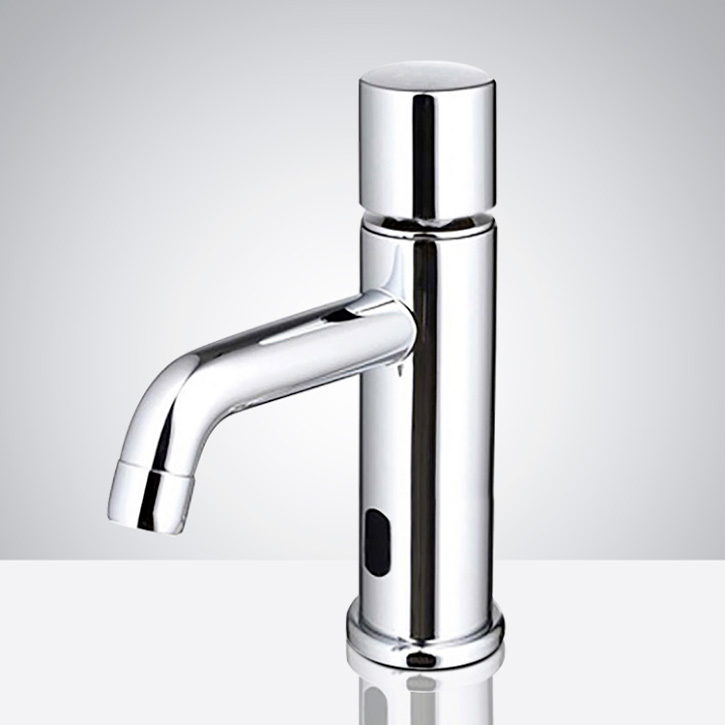
Robust Fixture With Practical Daily Operation
The commercial faucet combined a refined swan profile with the durability needed for regular facility use. The fixture felt substantial after installation and maintained dependable hands-free operation, while the chrome finish gave the washroom a more polished appearance. The overall combination of styling, construction and automatic control worked well for a busy commercial setting.View Live Product →
Fontana Chrome Commercial Automatic Motion Sensor Faucet
Durable Design for Busy Commercial Space
The polished chrome fixture brought a contemporary architectural detail to the washroom while retaining the substantial construction expected for frequent commercial use. The faucet felt strong after installation and suited a project where the design team wanted appearance and operational durability to work together rather than compete with each other.View Live Product →